Sickness
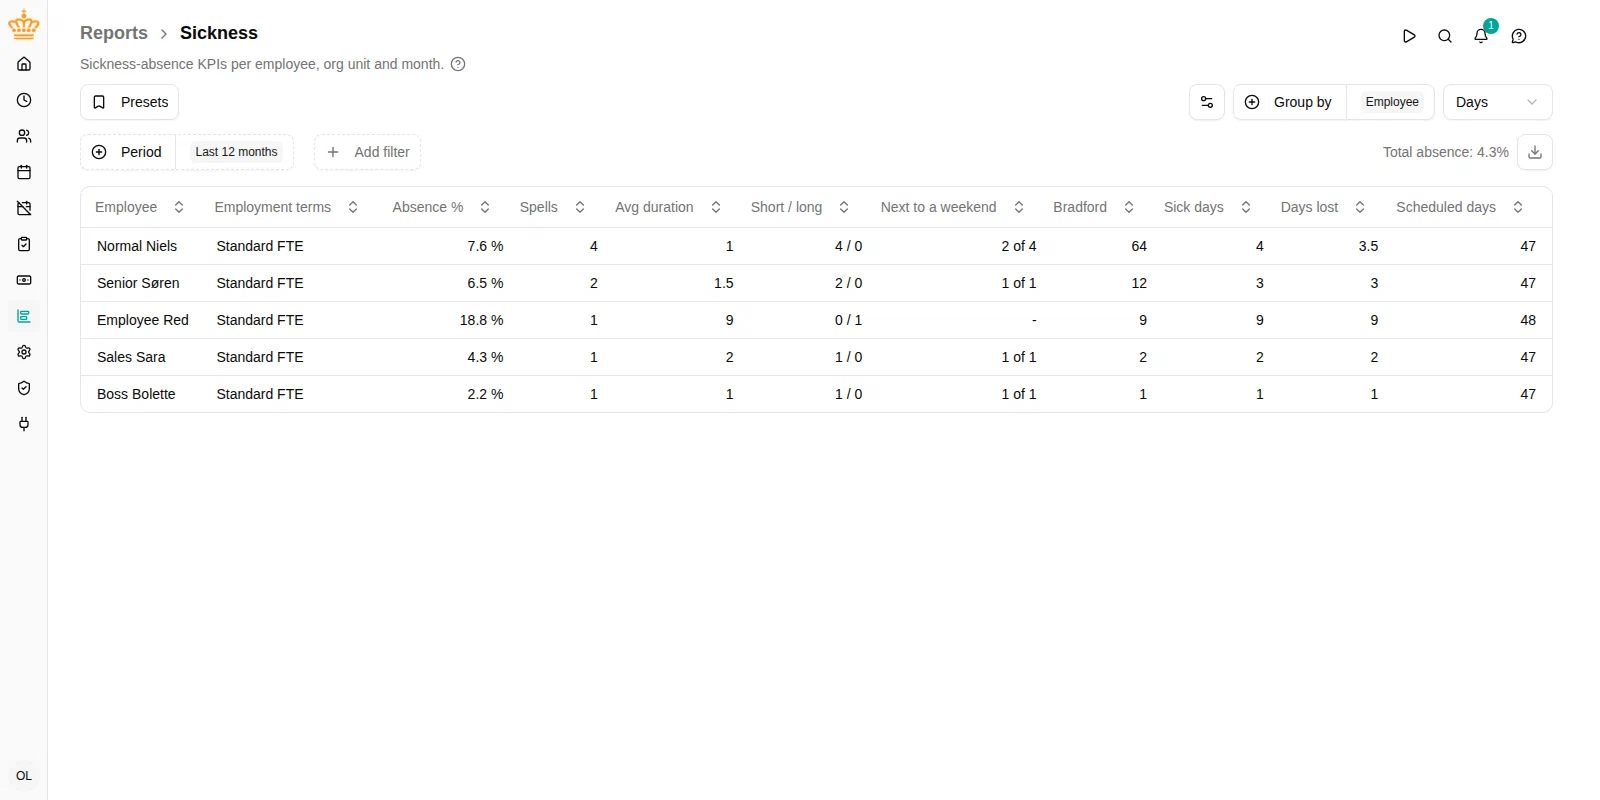
Follow sickness absence with the key figures HR reports on: absence rate, how often people are off sick, how long spells last, and the Bradford Factor.

Sickness is health data, so this report also needs access to sensitive absence information: managers see it for their own reports and administrators for everyone. A role that can read reports but not sensitive absence data, such as Read-only, cannot open it.
Overview
The Sickness report answers the questions that come up in sickness follow-up:
- How much working time do we lose to sickness, per department and per employee?
- Who has an unusual pattern of frequent short absences?
- Who is often off sick right before or after a weekend?
- How much of our sickness is short-term, and how much is long-term?
- How does one month compare with another?
Navigate to in the sidebar.
The period defaults to Last 12 months — the window sickness key figures, and the Bradford Factor in particular, are normally read over. You can change it like on any other report.
What counts as sickness
The report counts time registered on time off activities whose Category is Sickness . The category is set per activity under , so if an activity is missing from this report, check its category first. Vacation and other time off never affect these figures.
Sickness only counts on days the employee was scheduled to work. Sick leave recorded on a weekend, on a public holiday, or on a part-time employee’s day off is ignored — no working time was lost.
Filtering
Besides the common filters (period, org unit, manager, employment terms), you can narrow down by:
- Activities — one or more specific sickness activities (empty = all of them). Only activities categorised as sickness are offered; picking a parent activity includes the ones beneath it.
Sickness spells
A spell (or episode) is one continuous period of sickness, however many days it covers. Spells are what make frequency comparable: five separate two-day absences are a very different picture from one ten-day absence, even though both cost ten days.
mTime builds spells from the employee’s own working calendar. Two sick days belong to the same spell when the only days between them are days that employee wasn’t scheduled to work anyway. A day back at work always ends the spell, and a long gap always starts a new one.
Two settings behind the Spell settings button let you match your own policy:
- Short-term (days) — spells of this many sick days or fewer count as short-term, longer ones as long-term. Default 5.
- Bridge gap (days) — how many of the employee’s own non-working days a single spell may span. Default 3, which bridges a weekend plus one adjacent public holiday, but not a full working week.
An example with the defaults: someone off sick Friday and the following Monday has one spell of two sick days, because only the weekend lies between. If they worked the Monday and were off sick again on the Tuesday, that is two spells.
Grouping the results
The Group by control decides what each row represents. Pick any combination of:
- Org unit
- Employee (also adds an employment terms column)
- Country (shown only if your workspace uses work countries)
- Month
Each row is one combination of the selected groupings — group by Employee (the default) for a per-person overview, by Org unit to compare departments, or by Org unit and Month together to follow a department over time. Clear all groupings to get a single overall line.
There is no grouping by day: spells and the Bradford Factor describe a run of days and mean nothing for a single date. To see sickness per day or per day of the week, use the Absence overview with the category filter set to sickness.
Rows only appear where there was at least one sick day, so the table stays short. Employees with no sickness still count towards the absence rate of their department or month — a department’s rate is its lost time over the scheduled time of everyone in it, not just of those who were sick.
Rows are sorted by Bradford Factor, highest first, so the most striking patterns are on top. Click any column header to sort differently.
Reading the columns
| Column | What it shows |
|---|---|
| Absence % | Working time lost to sickness as a share of scheduled working time |
| Spells | Number of sickness spells that started in the period |
| Avg duration | Average number of sick days per spell |
| Short / long | Spells at or under the short-term threshold, and spells above it |
| Next to a weekend | Of the single sick days, how many fell right before or after a weekend (see below) |
| Bradford | The Bradford Factor (see below) |
| Sick days | Number of scheduled working days with sickness on them |
| Days lost | Working time actually lost, in days |
| Scheduled days | Scheduled working time the figures are measured against |
Sick days and Days lost answer two different questions, and half days are where they part company. A half day of sickness is one sick day — the person was off sick that day, which is what frequency, average duration and the Bradford Factor are about — but only half a day lost, which is what the absence rate is about. A single day never counts as more than a full day lost, however much is registered on it.
The Bradford Factor
The Bradford Factor is the classic HR score for spotting disruptive absence patterns. It multiplies the number of spells, squared, by the total number of sick days:
Bradford = spells × spells × sick days
Squaring the spell count is the point: frequent short absences score far higher than one long absence of the same total length.
| Pattern over the period | Spells | Sick days | Bradford |
|---|---|---|---|
| One spell of 10 days | 1 | 10 | 10 |
| Five spells of 2 days | 5 | 10 | 250 |
| Ten single days | 10 | 10 | 1000 |
Above employee level — on a department or month row — the figure is the average score of the employees in that group who had sickness, so a large department isn’t penalised for its size. A spell counts towards the month its first sick day falls in.
Because the score grows with the length of the window, only compare Bradford figures read over the same period. Treat a high score as a prompt for a conversation, not as a conclusion.
Sickness next to a weekend
The Next to a weekend column helps with a question that often comes up in sickness follow-up: is someone regularly off sick on a Friday or a Monday, turning a weekend into a long weekend?
It is shown as x of y:
- y is the number of single sick days — spells of just one sick day. A sick Friday and the following Monday also count, as one occasion, because that is the clearest case of the pattern.
- x is how many of those fell right before or after the employee’s weekend.
Longer spells are left out, so that a long illness doesn’t hide the pattern.
The weekend follows the employee’s own working schedule. For most people the days next to it are Friday and Monday, but for someone who never works Fridays it is Thursday, and for someone who never works Mondays it is Tuesday. A weekend made longer by public holidays counts too — a sick day on the last working day before Easter is next to a weekend.
Read the figure with care. Even when sickness strikes completely at random, about 2 in 5 single sick days of a full-time employee fall next to a weekend, simply because two of their five working days touch it. 3 of 7 is therefore quite normal; 7 of 8 stands out. Small numbers vary a lot — 1 of 1 says nothing — and there can be good reasons behind a pattern, such as recurring treatment. Use the figure as a prompt for a conversation, never as evidence on its own.
An example: over the last 12 months an employee has had seven single sick days. Three were Fridays, two were Mondays and two were Wednesdays. The column shows 5 of 7.
Days or hours
Use the unit selector to switch between Days and Hours . In hours mode, Days lost and Scheduled days become Sick hours and Scheduled hours .
Absence % is the same figure either way — it is always lost working time over scheduled working time, so part-time employees and varying norms are weighted correctly.
Total absence
Above the table, Total absence gives the overall absence rate for everybody in scope, including the employees with no sickness at all. This is the figure to quote as “our sickness absence rate” for the selected period and filters.
Exporting
Click the download button at the right of the filter bar (Export to Excel
) to download the current view as an .xlsx file. The export uses the same filters, groupings, spell settings and unit as the table on screen, and adds the number of short-term and long-term sick days alongside the spell counts. The Next to a weekend
figure is exported as two columns — the single sick days, and how many of them were next to a weekend — so you can work with the numbers yourself.