Absence overview
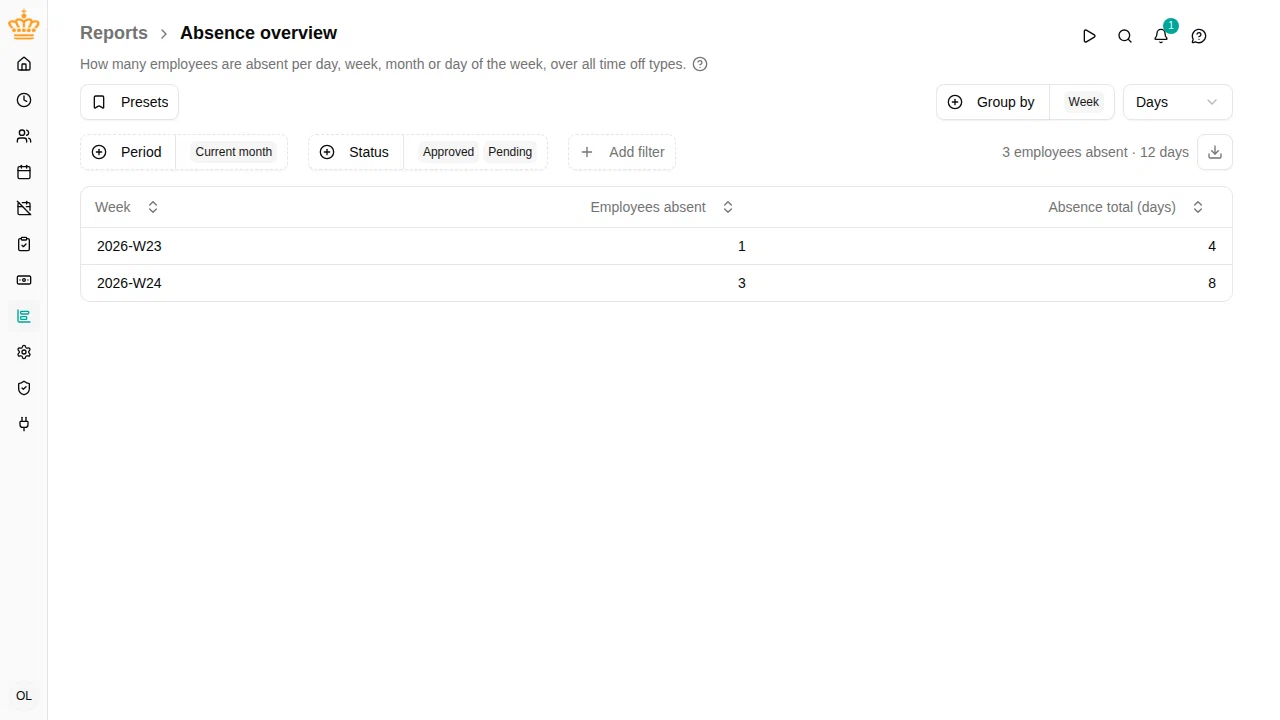
See how many employees are absent over a period — per day, week, month or day of the week — across all types of time off.

If you can’t see sensitive absence information for an employee, their sick leave is left out of this report, totals included.
Overview
The Absence overview report answers coverage and staffing questions that the other reports can’t, such as:
- How many employees are away on each day of a period?
- How many people are on time off this month, by department?
- Which types of time off account for the most days?
- Are people more often off sick on some days of the week than on others?
Unlike Registered hours (which sums the time registered), this report counts the number of distinct employees absent in each group, alongside the total absence duration. An absence that spans several days is counted on each day it covers.
Navigate to in the sidebar.
Filtering
Besides the common filters (period, org unit, manager, employment terms), you can narrow down by:
- Category — sickness, vacation, time off in lieu, personal or other (empty = all)
- Activity — one or more specific activities (empty = all)
- Status — Approved and/or Pending absences (both by default) Approved covers every absence already on the timesheet — approved time off requests as well as time registered directly on a time off activity.
Grouping the results
The Group by control decides what each row represents. Pick any combination of:
- Org unit
- Employee (also adds an employment terms column)
- Country (shown only if your workspace uses work countries)
- Activity
- Month , Week , Weekday or Day
Each row is one combination of the selected groupings — for example, group by Day to get one row per date with the count of employees absent that day, or by Month to roll a longer period up per month. Clear all groupings to get a single overall total.
Day rows show the day of the week in front of the date (for example Fri, Sep 11, 2026), so a pattern is easy to spot as you scroll.
Each row shows two figures: Employees absent (the distinct headcount in that group) and the absence total. The total row’s headcount is the distinct number of people absent across the whole period, so someone absent on several days is counted once there.
Absence by day of the week
Group by Weekday to fold every Monday of the period into one row, every Tuesday into the next, and so on, from Monday to Sunday. Combined with the Category filter set to sickness, this answers “are we more often off sick on Fridays?” for the whole company. Add Org unit or Employee to break it down further.
The figures are totals, not rates. Some weekdays have fewer working days in a period than others — public holidays fall on Mondays and Thursdays more often, and part-time employees may not work Fridays at all — so compare weekdays with that in mind. To look at an individual’s sickness around weekends, use the Next to a weekend column of the Sickness report instead: it leaves out long sickness, which would otherwise add to every weekday alike.
Half and partial days
An employee counts toward a day’s Employees absent figure if they are absent for any part of that day. Their partial duration still contributes to the absence total.
Days or hours
Use the unit selector to switch the absence-total column between Days and Hours . Days divide each employee’s absent time by their own daily working norm, so part-time employees are counted fairly.
Exporting
Click the download button at the right of the filter bar (Export to Excel
) to download the current view as an .xlsx file. The export uses the same filters, groupings, and unit as the table on screen. When you group by day, a Weekday
column next to the date lets you sort or pivot by day of the week in Excel.